Segment_Analysis_through_SQL
Project 1: Segment Analysis through SQL
1 Overview
In this project, I designed and created a database similar to what a simplified Enterprise Resource Planning (ERP) might be. I wanted to segment customers by distribution channel and extrapolate some business data (such as the operating margin by distribution channel).
With this project I wanted to demonstrate my ability to:
- Understand the logic of a database
- Use basic (sum, extract, order by, etc.) and intermediate (pivoting, case/when, cast, inner join, group by, etc.) commands to extract data from a database
The tools I used for the project are PostgresSQL and Excel.
Operating margin by distribution channel:
| distribution channel | 2020 | 2021 |
|---|---|---|
| small | 20783 | 5791 |
| medium | 30362 | 14501 |
| large | 2765 | 4535 |
2 Objectives of the project
The two main goals I wanted to bring home with this project were:
- Create a structured database like what a corporate ERP can be
- Solve real questions that may be in an enterprise
More specifically, the database and the queries I have created should segment customers and report margins by customer, distribution channel, single product, and so on.
3 Phases of the project
3.1 Thinking about the infostructure
Thinking about how to structure the database’s tables I wanted to replicate the back-end of an ERP software.
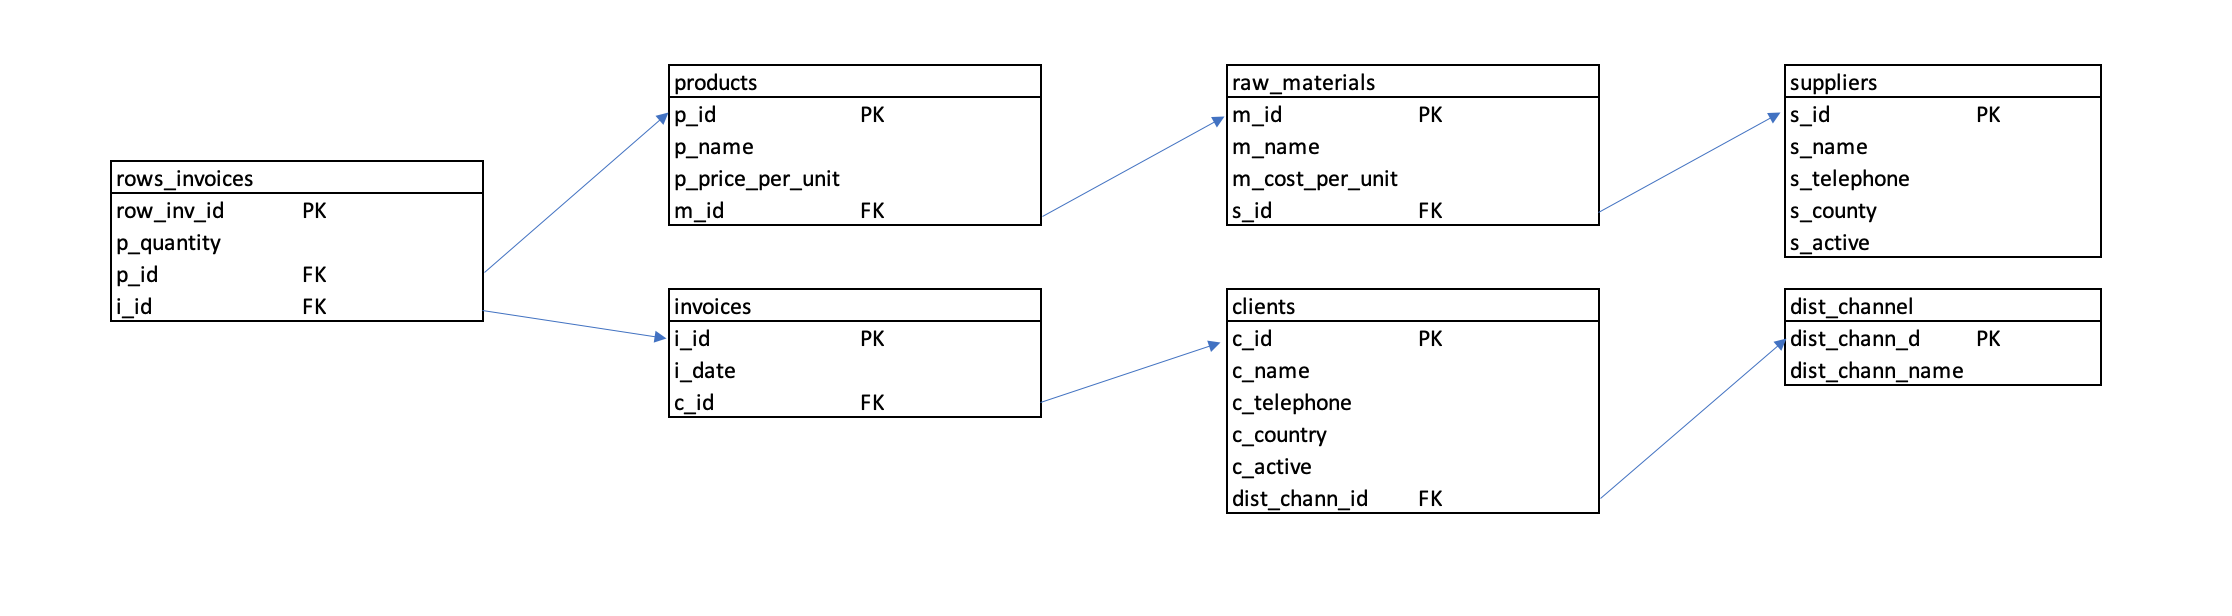
The tables I created are the following:
- (i) Suppliers: here will be contained the main information of the suppliers
- (ii) Raw materials: here will be contained the main information of raw materials, a critical information will be the unit cost of them
- (iii) Products: this table will contain product information such as name, price, type of raw material to create it, etc.
- (iv) Rows invoices: here will be stored data about single lines in transactions between company and customers
- (v) Invoices: here we could know the invoice date and reference customer
- (vi) Clients: here will be contained the main information of the clients
- (vii) Distribution channels: here will be the distribution channels, useful for customer segmentation
3.2 Create tables
The complex part in thinking about how to structure the database concerns the minimization of redundant data in the various tables and the effectiveness of the data in the database when it will be interrogated with queries.
3.3 Importing the data through csv file
To be faster and to experiment with the import/export features of PostgreSQL, I first populated the tables in Excel sheets and then they were massively imported into the tables created earlier in PostgreSQL.
Warning: the population of data entered in the tables were either randomized by Excel or invented by me.
3.4 Thinking about business questions
Customer segmentation has always been the main purpose of the project, so the key question is: (a) what is the operating margin by distribution channel? Then I went deeper and calculated the (b) operative margin per customer within all the years and per (c) single product.
After the questions just mentioned I wanted to answer other questions such as:
- (d) Calculate revenue per year
- (e) Calculate the revenue per single month
- (f) Calculate the ratio of active customers to total customers
3.5 Create view for each answer
To store the answers to the queries I have created views, so if the question will be recurrent it will be easy to access them.
4 Code
4.1 Create tables
(i) Suppliers
CREATE TABLE suppliers(
	s_id INTEGER PRIMARY KEY,
	s_name VARCHAR(100),
	s_telephone VARCHAR(50),
	s_country VARCHAR(50),
	s_active BOOLEAN
)
(ii) Raw materials
CREATE TABLE raw_materials(
	m_id INTEGER PRIMARY KEY,
	m_name VARCHAR(100),
	m_cost_per_unit INTEGER CHECK (m_cost_per_unit > 0),
	s_id INTEGER REFERENCES suppliers(s_id)
)
(iii) Products
CREATE TABLE products(
	p_id INTEGER PRIMARY KEY,
	p_name VARCHAR(100),
	p_price_per_unit INTEGER CHECK (p_price_per_unit > 0),
	m_id INTEGER REFERENCES raw_materials(m_id)
)
(iv) Rows invoices
CREATE TABLE rows_invoices(
	row_inv_id INTEGER PRIMARY KEY,
	p_quantity INTEGER CHECK (p_quantity > 0),
	p_id INTEGER REFERENCES products(p_id),
	i_id INTEGER REFERENCES invoices(i_id)
)
(v) Invoices
CREATE TABLE invoices(
	i_id INTEGER PRIMARY KEY,
	i_date DATE,
	c_id INTEGER REFERENCES clients(c_id)
)
(vi) Clients
CREATE TABLE clients(
	c_id INTEGER PRIMARY KEY,
	c_name VARCHAR(100),
	c_telephone VARCHAR(50),
	c_country VARCHAR(50),
	c_active BOOLEAN,
	dist_chann_id INTEGER REFERENCES dist_channel(dist_chann_id)
)
(vii) Distribution channels
CREATE TABLE dist_channel(
	dist_chann_id INTEGER PRIMARY KEY,
	dist_chann_name VARCHAR(100)
)
4.2 Queries
(a) What is the operating margin by distribution channel?
SELECT *
FROM  crosstab(
	$$
	SELECT dist_channel.dist_chann_name, EXTRACT(YEAR FROM i_date) AS year, SUM((p_price_per_unit - m_cost_per_unit) * p_quantity) AS operative_margin
	FROM raw_materials
	INNER JOIN products
		ON raw_materials.m_id = products.m_id
	INNER JOIN rows_invoices
		ON products.p_id = rows_invoices.p_id
	INNER JOIN invoices
		ON rows_invoices.i_id = invoices.i_id
	INNER JOIN clients
		ON invoices.c_id = clients.c_id
	INNER JOIN dist_channel
		ON clients.dist_chann_id = dist_channel.dist_chann_id
	GROUP BY dist_channel.dist_chann_id, EXTRACT(YEAR FROM i_date)
	ORDER BY dist_channel.dist_chann_id, EXTRACT(YEAR FROM i_date)
	$$,
	'VALUES (2020), (2021)'
) AS pivot ("Distribution channel" text, "2020" int, "2021" int)
(b) Operative margin per customer in all years
SELECT c_name, SUM((p_price_per_unit - m_cost_per_unit) * p_quantity)
FROM raw_materials
INNER JOIN products
	ON raw_materials.m_id = products.m_id
INNER JOIN rows_invoices
	ON products.p_id = rows_invoices.p_id
INNER JOIN invoices
	ON rows_invoices.i_id = invoices.i_id
INNER JOIN clients
	ON invoices.c_id = clients.c_id
GROUP BY c_name
ORDER BY SUM ((p_price_per_unit - m_cost_per_unit) * p_quantity) DESC
(c) Unit operative margin per product
SELECT p_name, (p_price_per_unit - m_cost_per_unit) AS marginality
FROM products
INNER JOIN raw_materials
	ON products.m_id = raw_materials.m_id
(d) Calculate revenue per year
SELECT SUM(p_quantity * p_id) AS amount, EXTRACT(year FROM i_date) AS year
FROM rows_invoices
INNER JOIN invoices
	ON invoices.i_id = rows_invoices.i_id
GROUP BY EXTRACT(year FROM i_date)
(e) Calculate the revenue per single month
SELECT SUM(p_quantity * p_id) AS amount, TO_CHAR(i_date, 'YYYY-MM') AS year
FROM rows_invoices
INNER JOIN invoices
	ON invoices.i_id = rows_invoices.i_id
GROUP BY TO_CHAR(i_date, 'YYYY-MM')
ORDER BY year
(f) Calculate the ratio of active customers to total customers (%)
SELECT( CAST( SUM(
	CASE
		WHEN c_active IS true THEN 1 ELSE 0
	END)
	AS float) /
	COUNT(*) * 100
) AS active_clients_ratio
FROM clients
5 Output of the code
(a) What is the operating margin by distribution channel?
In this first output we can highlight three columns, in the first there is the name of the distribution channel, in the second the year of belonging and in the third the summed values referred to the previous columns.
| dist_chann_name | year | operative_margin |
|---|---|---|
| small | 2020 | 20783 |
| small | 2021 | 5791 |
| medium | 2020 | 30362 |
| medium | 2021 | 14501 |
| large | 2020 | 2765 |
| large | 2021 | 4535 |
To make the previous table more readable, I pivoted the data and changed the identifier to the actual name of the distribution channel.
| distribution channel | 2020 | 2021 |
|---|---|---|
| small | 20783 | 5791 |
| medium | 30362 | 14501 |
| large | 2765 | 4535 |
(b) Operative margin per customer in all years
In the first column there are the names of the customers, in the second column the sum of the operating margin (found as price * quantity - unit cost * quantity), the data refers to both years considered.
| c_name | sum |
|---|---|
| justvest | 13373 |
| zerosoar | 12287 |
| advertisingyern | 11207 |
| milksoul | 8177 |
| completeyeve | 7889 |
| germanwork | 7462 |
| ninjapick | 3500 |
| leadinglife | 3095 |
| earvary | 2864 |
| uberjust | 2765 |
| pixopen | 1620 |
| myhomeamin | 1505 |
| illinoisease | 875 |
| armypert | 740 |
| foxgiift | 490 |
| plasticdote | 420 |
| customerpoof | 280 |
| lucklook | 140 |
| socialmediaokey | 40 |
| archizero | 8 |
(c) Unit operative margin per product
In the first column there are the names of the products, in the second there is the operating margin (found as price - unit cost), the figure is unitary, that is how much the company margins for a single product sold.
| p_name | marginality |
|---|---|
| jar | 60 |
| wheel | 35 |
| chair | 37 |
| bottle | 8 |
| bicycle | 125 |
(d) Calculate revenue per year
Here we have the sum of the unpacked revenue by individual year.
| amount | year |
|---|---|
| 1666 | 2021 |
| 2756 | 2020 |
(e) Calculate the revenue per single month
Here we have the sum of the unpacked revenue by individual month.
| amount | year |
|---|---|
| 431 | 2020-01 |
| 85 | 2020-03 |
| 458 | 2020-06 |
| 152 | 2020-07 |
| 74 | 2020-08 |
| 632 | 2020-09 |
| 250 | 2020-10 |
| 317 | 2020-11 |
| 357 | 2020-12 |
| 272 | 2021-02 |
| 60 | 2021-03 |
| 50 | 2021-04 |
| 50 | 2021-05 |
| 149 | 2021-06 |
| 28 | 2021-07 |
| 663 | 2021-10 |
| 300 | 2021-11 |
| 94 | 2021-12 |
(f) Calculate the ratio of active customers to total customers (%)
With this output I wanted to answer the question: how many are your actual active customers? In the customers table there is a column of boolean type that can help us I simply counted the active customers and divided by the total customers.
| active_clients_rato |
|---|
| 70 |
Press here to return in the portfolio.